Can sample volume be reduced in particle testing by light obscuration?
An interlaboratory study evaluated light obscuration particle counting at 5, 1 and 0.2 mL, showing little impact at 1 mL and feasible results at 0.2 mL with prior method verification.
Can sample volume be reduced in particle testing by light obscuration?
25 Aug 2026 12 min read
An interlaboratory study evaluated light obscuration particle counting at 5, 1 and 0.2 mL, showing little impact at 1 mL and feasible results at 0.2 mL with prior method verification.
Yes. It is possible to reduce the sample volume in the insoluble particulate matter test by
Light Obscuration
from 5 mL to 1 mL without a relevant impact on reproducibility, and down to 0.2 mL with still viable results, though with greater statistical variability.
This is the central conclusion of an interlaboratory comparison conducted by Japanese researchers and published in the
journal
Biologicals
, which evaluated polystyrene standards of 2, 5, 10, and 25 µm across six laboratories.
The topic is not merely technical. The
United States Pharmacopeia (USP)
had already adopted, in 2014, a specific chapter for subvisible particles in therapeutic protein injections, indicating the possibility of reducing the assay volume from 5 mL to 0.2 mL.
However, a multilaboratory evaluation of the effect of this reduction on accuracy and precision was lacking. The study also served as one of the bases for the proposal of a new general test for insoluble particles with reduced volume in the
Japanese Pharmacopoeia (JP)
, put out for public consultation in 2017.
In this article, you will understand:
what Light Obscuration is and how the method works;
why the 5 mL volume became a problem for biopharmaceuticals;
how the interlaboratory study was designed;
what happened to precision at 1 mL and 0.2 mL;
why the increased variability does not mean method failure;
why the 25 µm particles performed worse precisely at the larger volume;
when the equipment setup starts to interfere with the result;
what the study allows and does not allow us to conclude.
What is Light Obscuration?
Light Obscuration
is a technique for
counting and sizing particles
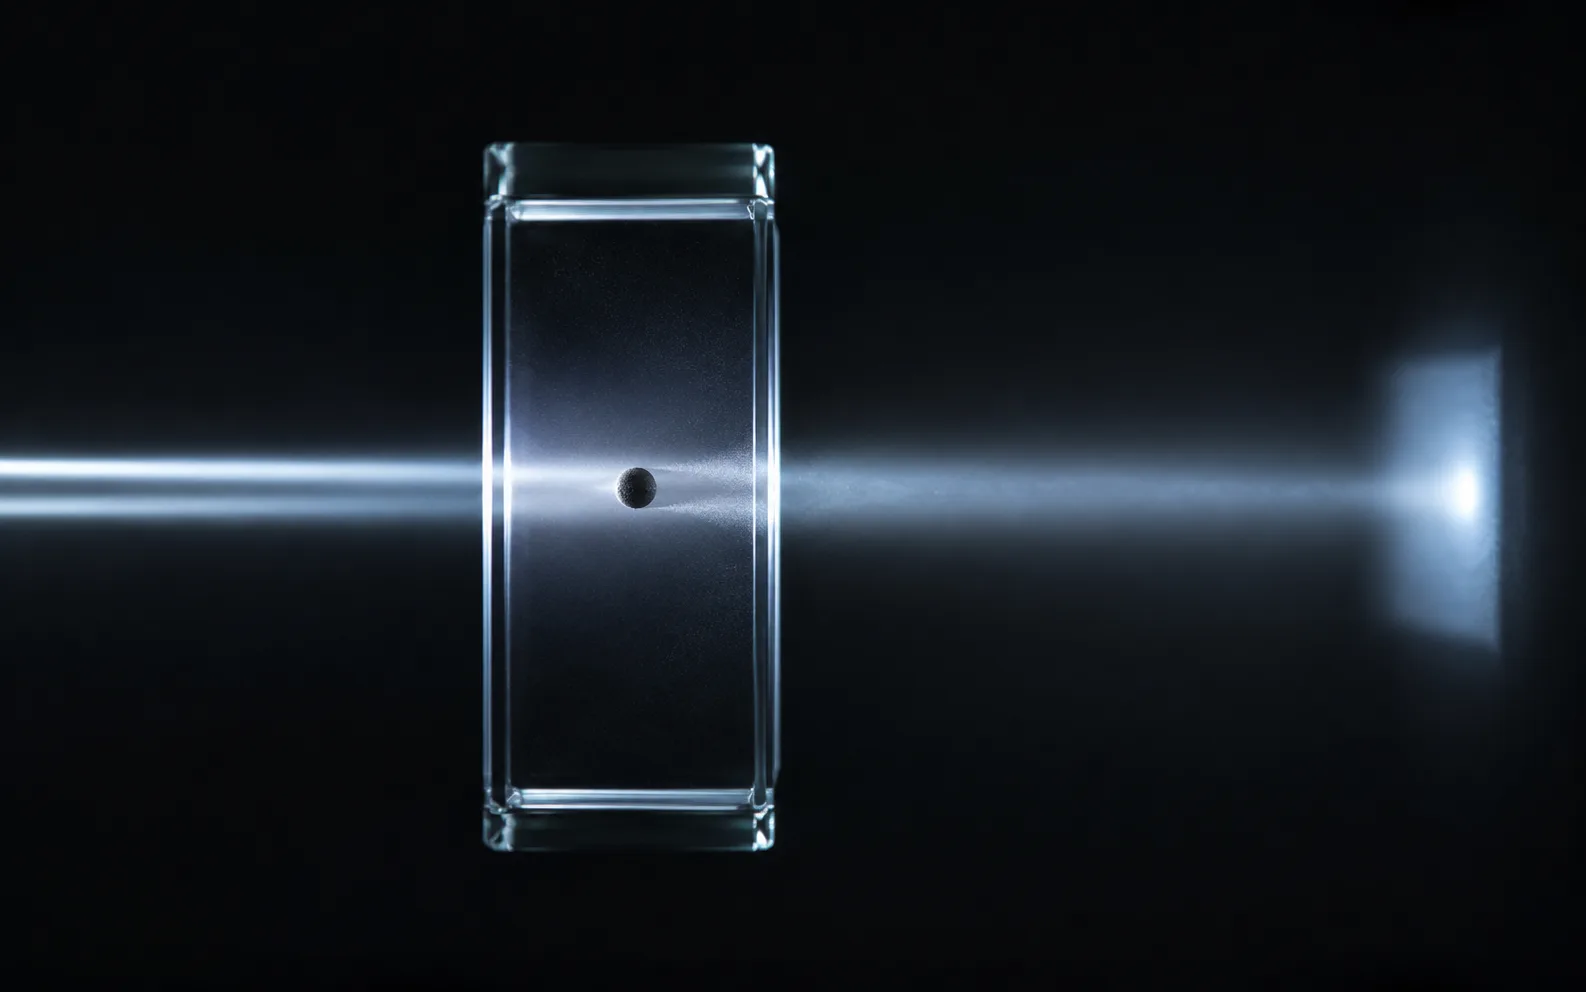
in suspension based on the interruption of a light beam. The sample passes through an optical cell, and when a particle crosses the beam, it blocks part of the light that would reach the detector.
The intensity of this reduction is correlated with the particle size. The number of recorded events allows estimating the concentration per volume analyzed.
In practice, the method provides the number of particles per milliliter, the size distribution by size ranges, and counts at specific regulatory limits, such as ≥10 µm and ≥25 µm.
Therefore, Light Obscuration is the preferred method for the insoluble particulate matter test in injectables, harmonized among the American, European, and Japanese pharmacopoeias.
The method has an important boundary condition: it depends on the adequate passage of light through the sample. Emulsions, colloids, and
liposomal preparations
can make its application unfeasible.
Why reduce the sample volume in the insoluble particulate matter test?
In the traditional pharmacopoeial procedure, four measurements of at least 5 mL each are required. This design was conceived in a scenario of larger-volume injectables.
The problem arises with modern biological products. Therapeutic protein injections filled in low volumes, generally below 1 mL, have become common because subcutaneous administration by the patient themselves is preferred for chronic diseases.
According to the authors, for products with a labeled quantity of less than 25 mL, it may be necessary to pool the contents of
ten or more containers
to reach the volume required by the assay.
This combination brings concrete consequences:
high consumption of a high-value product;
increased assay cost;
more handling and more opportunities for external particulate contamination;
loss of information about the particle count in each individual unit.
Reducing the volume, therefore, is not sample economy. It is adapting the assay to the reality of the drugs it needs to control.
How was the interlaboratory study conducted?
The work was structured as a comparison between laboratories to evaluate the effect of volume reduction on the accuracy and precision of Light Obscuration counting.
Instead of real formulations, the researchers used polystyrene counting standards traceable to
NIST
, with a nominal concentration of 3000 particles/mL ±10%. All laboratories worked with the same lots.
Four diameters (2, 5, 10, and 25 µm) were evaluated at three measurement volumes: 5 mL, 1 mL, and 0.2 mL. Before each test, a pre-run volume of 0.2 mL was passed through the system. Each test included four measurements, of which the last three were used in the calculation.
One of the instruments used in two of the laboratories was the
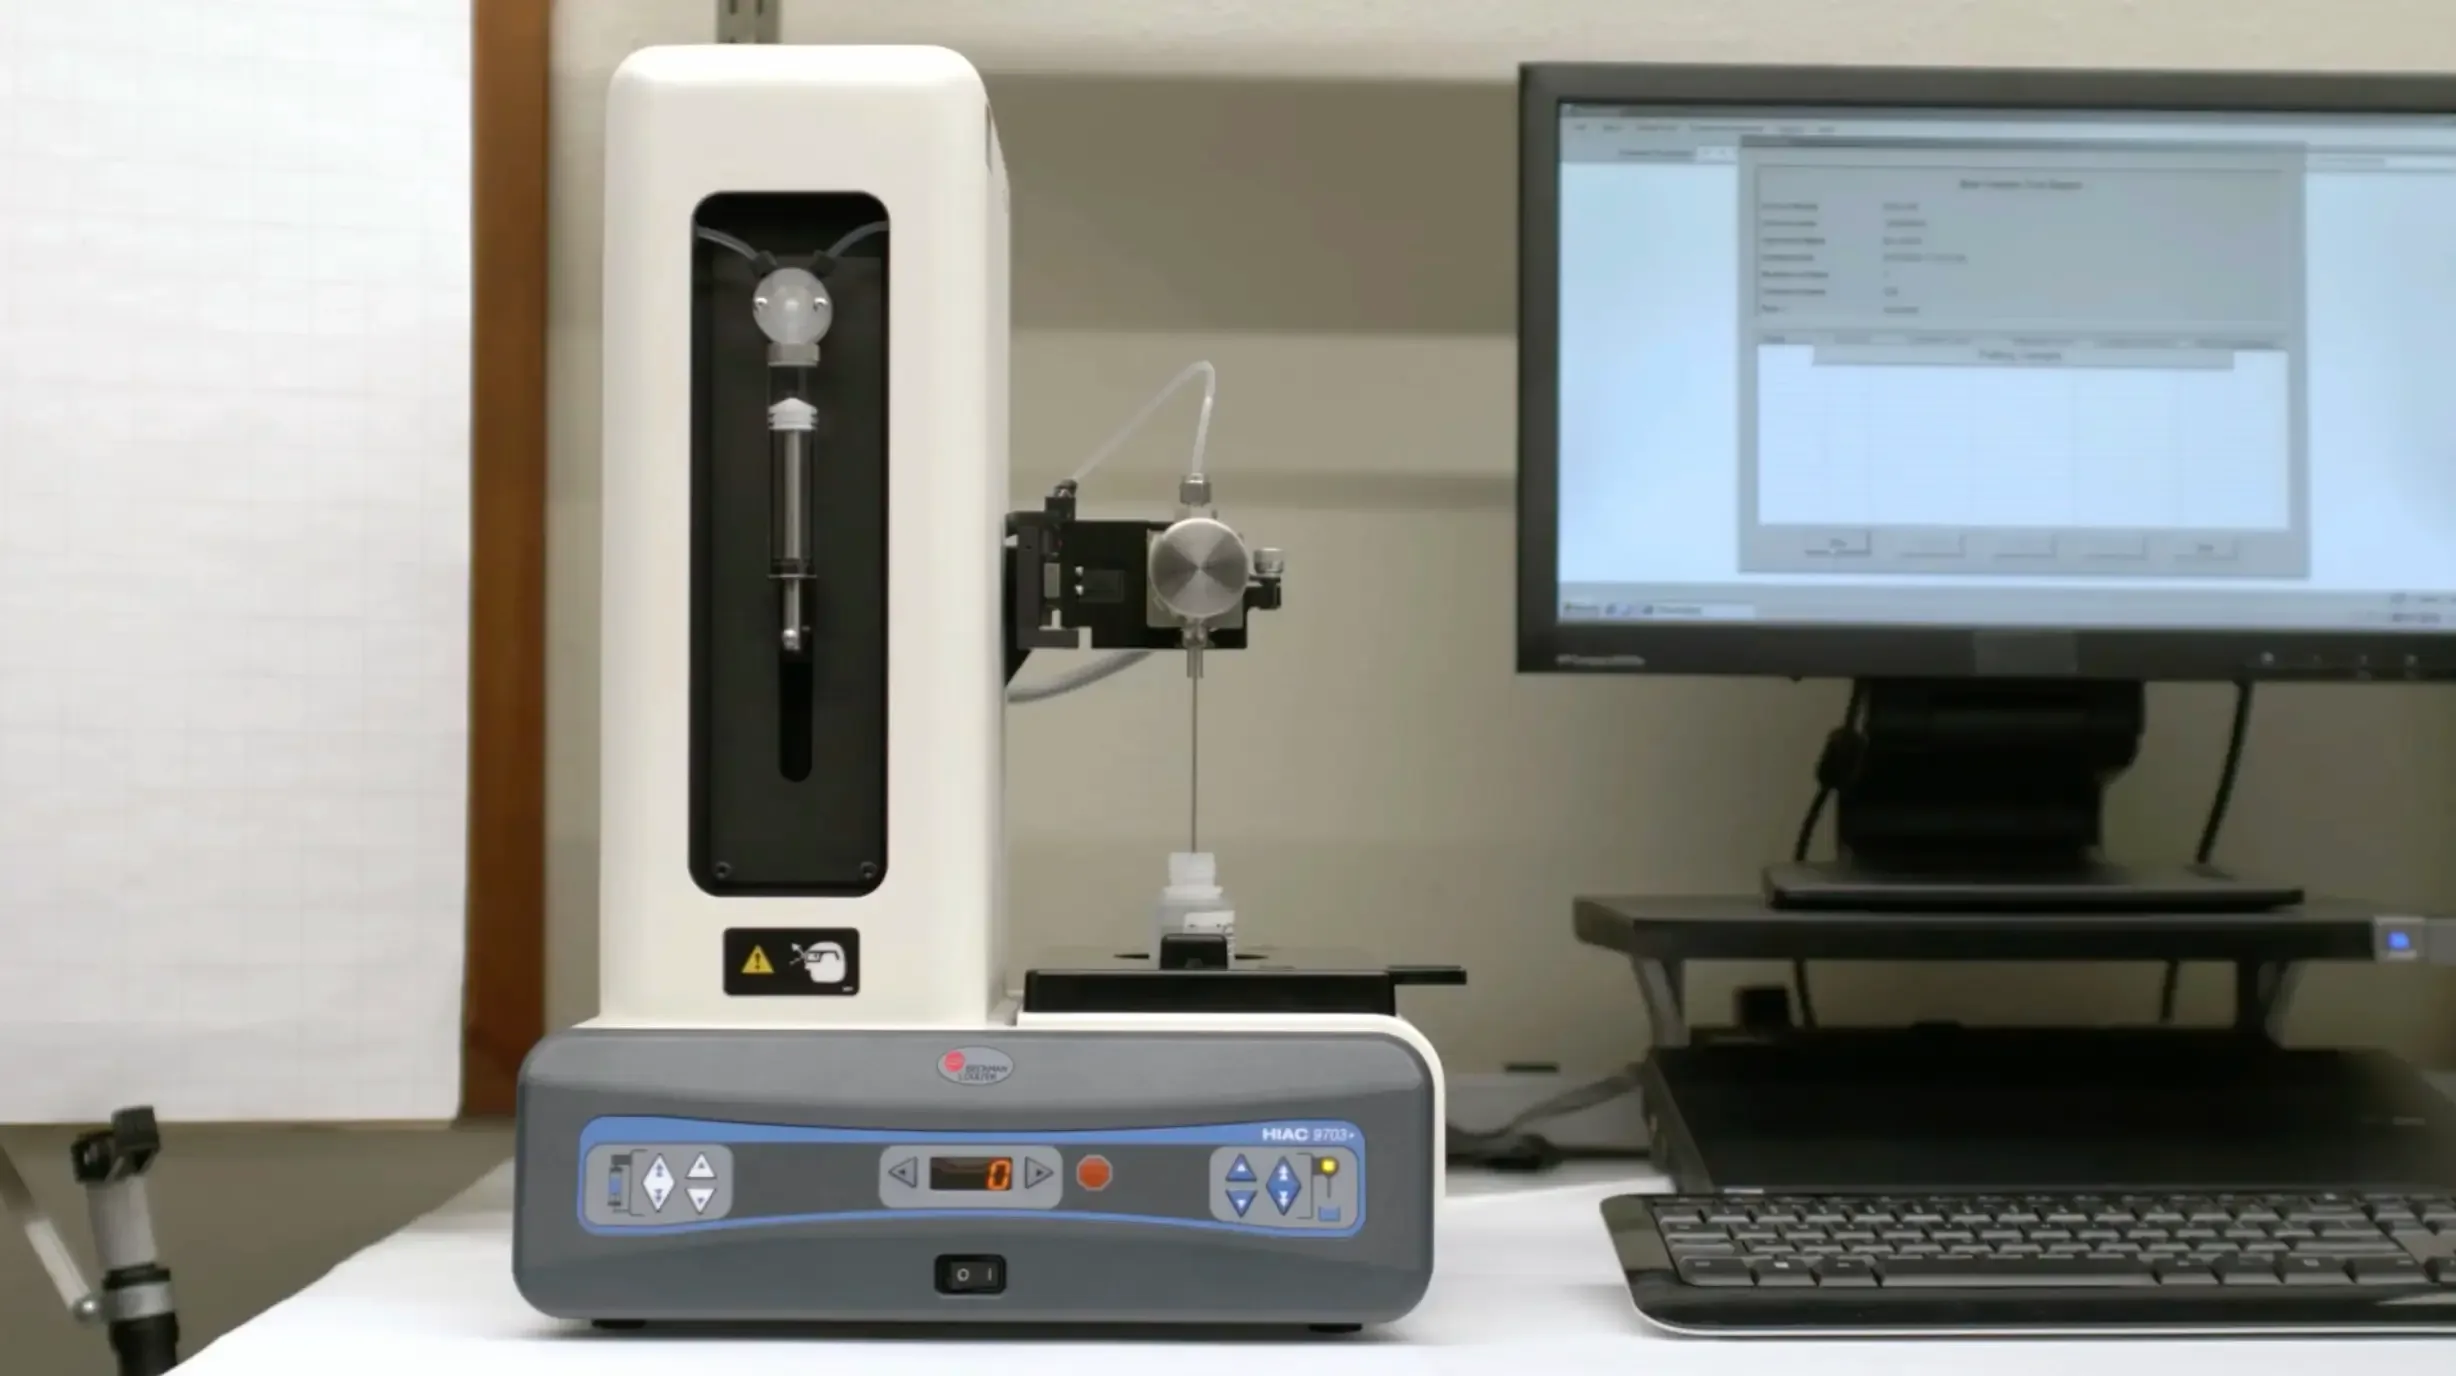
HIAC 9703
,
available in the Innotec catalog. The instruments served as platforms to investigate the central question of the work, and not as objects of comparison with each other.
HIAC 9703+ Particle Counter for pharmaceutical quality control. USP 788 compliance, 1mL samples, precision >95%. Request a quote!
This design defines the scope of the results: the study evaluated the analytical performance of the method with controlled standards, not the validation of the procedure in real biological drugs.
What happens when reducing from 5 mL to 1 mL?
This is the most direct result of the work. The between-assay precision at 1 mL remained practically equivalent to that observed at 5 mL, across the entire 2 to 25 µm range.
The relative standard deviation (RSD) values between assays were:
Size
5 mL
1 mL
0.2 mL
2 µm
3.1%
3.8%
4.5%
5 µm
1.6%
1.7%
3.6%
10 µm
1.7%
2.0%
3.3%
25 µm
2.7%
3.1%
4.7%
For 5 and 10 µm, the difference between 5 mL and 1 mL is practically irrelevant. For the other sizes, there was no significant deterioration.
The authors add a point of practical weight: the additional variability introduced by using 1 mL tends to be
smaller
than the variability between equipment, between laboratories, and that arising from sample handling itself.
According to the study, reducing the volume from 5 mL to 1 mL has little effect on the reproducibility of the assay, and can be done with the calibration procedures already described in the current pharmacopoeias.
And when the volume drops to 0.2 mL?
At 0.2 mL, the situation changes in nature. The mean counts remained within the expected range of 3000 particles/mL ±10%, and the between-assay RSD remained below 5% for all sizes. However, the dispersion increased consistently.
The decisive point of the study is the explanation for this increase. It was not attributed to loss of equipment performance, but to counting statistics.
When particles are randomly distributed, the count follows the Poisson distribution, in which the standard deviation equals the square root of the counted number. Reducing the analyzed volume reduces the absolute number of counted events, and the relative variation increases as a mathematical consequence.
The authors compared the standard deviation observed within each assay with the value predicted by Poisson:
Volume
Predicted by Poisson
Observed (2 / 5 / 10 / 25 µm)
5 mL
24
35 / 38 / 27 / 192
1 mL
55
47 / 62 / 71 / 71
0.2 mL
122
116 / 127 / 126 / 140
With the exception of the 25 µm particles at 5 mL, the measured values closely follow the predicted ones.
The greater dispersion at 0.2 mL is the expected statistical behavior of counting fewer particles, not a sign that the method has stopped working.
This does not eliminate the need for caution. It only means that the result at very low volumes needs to be interpreted with this dispersion in mind.
Why did the 25 µm particles require special attention?
Here is the most counterintuitive finding of the work, and what is often misinterpreted in hasty readings.
The
within-assay
variability for 25 µm particles spiked precisely at the largest volume. At 5 mL, the standard deviation of the three measurements reached 192, compared to 71 at 1 mL and 140 at 0.2 mL. Furthermore, the count of the fourth fraction was systematically lower than that of the second and third.
The explanation pointed out by the authors is sedimentation. Applying Stokes' Law, a spherical polystyrene particle of 25 µm with a density of approximately 1.05 g/cm³ sediments in water at about 1 mm/s.
It seems small. But a 5 mL analysis takes longer than a 1 mL analysis. The more time elapses after homogenization, the more large particles leave the sampling region.
Factors that amplify the effect include:
time elapsed since agitation;
position of the sampling tube in the vial;
volume available in the container;
total duration of the measurement sequence.
A larger volume is not automatically safer. For large particles, the longer assay may be precisely the one most susceptible to sedimentation.
The authors' recommendation is to analyze particles of this size immediately after homogenization, or with agitation during the measurement.
When does the equipment setup start to influence the result?
Reducing the volume is not changing a parameter and repeating the same procedure. At 0.2 mL, physical characteristics of the system represent a much larger fraction of the total volume analyzed.
Factors include the sample path, dead volume, accuracy of the aspirated volume, internal geometry, and the adopted instrumental configuration.
The study brought a concrete example. Two laboratories used the KL-04A equipped with a
compressing chamber
. In the analysis of 25 µm particles at 0.2 mL, the count dropped sharply. The authors attributed the effect to the longer intermediate path imposed by this configuration, one laboratory removed the chamber, the other remedied without it, and the data obtained with the chamber were excluded from the corresponding evaluation.
It is from this episode that the main caveat of the work arises: below 1 mL, the performance of the procedure needs to be previously verified in each laboratory.
Among the mentioned controls are the accuracy of the sample volume, the accuracy of the count within the pharmacopoeia-specified range, and the consistency between the three measurements used in the assay.
Does the method work for particles below 10 µm?
Within the evaluated conditions, yes. Traditional pharmacopoeial assays focus attention on ≥10 µm and ≥25 µm, limits defined considering the risk of capillary occlusion. The study extended the evaluation to 2 and 5 µm standards.
The results led the authors to conclude that Light Obscuration is viable for monitoring particles from 2 µm upwards.
This point has regulatory context. Protein products may contain, in addition to external and process-derived particles, aggregates of the protein itself or complexes with other formulation components. Regulatory guidance for immunogenicity assessment recommends monitoring both the ≥10 µm range and the 2 to 10 µm range throughout the product life cycle, without indicating specific methods for the smaller particles.
It is important to separate what is justification from what is experimental result. The study did not evaluate immunogenicity nor demonstrate a relationship between 2 to 10 µm particles and adverse events. This discussion appears as a motivation to expand the monitored range.
What the study allows us to conclude
The findings can be summarized objectively:
5 mL
- reference condition for the comparison.
1 mL
- precision equivalent to 5 mL; little effect on reproducibility, with current pharmacopoeial calibration procedures.
0.2 mL
- viable results, between-assay RSD below 5%, with dispersion compatible with Poisson statistics and greater sensitivity to instrumental configuration.
Below 1 mL
- performance needs to be previously verified by each laboratory.
Evaluated range
- 2, 5, 10, and 25 µm, with polystyrene standards traceable to NIST.
Equally important is what the work does not support. It used counting standards, not real drugs; it did not validate 0.2 mL for any formulation; it did not compare performance between the instrumental platforms used; and it did not evaluate aggregate immunogenicity.
It would be incorrect to read the study as “0.2 mL is sufficient to analyze any biopharmaceutical by Light Obscuration.” The real contribution is different: the 5 mL volume does not represent an absolute technical limit, and reduction is viable as long as the measurement system is understood and verified.
For laboratories working with low-volume, high-value products, the practical consequence is direct: less sample consumed, fewer vials pooled, preservation of information per individual unit, and fewer handling steps, which are themselves sources of particulate contamination.
Where to find particle counters
Innotec represents in Latin America lines of equipment for particulate systems and bioprocess analysis, including the
HIAC 9703+
, a liquid particle counter and analyzer from Beckman Coulter, the same instrumental line used as a platform in the interlaboratory study discussed in this article.
For subvisible particle control in injectables, the catalog allows filtering equipment directly by reference standards, such as
USP <787>
,
USP <788>
, and
EP 2.9.19
.
Frequently Asked Questions about Light Obscuration with reduced volume
What is the Light Obscuration method?
It is a technique for counting and sizing particles in suspension based on the obstruction of a light beam by particles passing through an optical cell. The drop in light intensity is correlated with the particle size.
What is the minimum sample volume in Light Obscuration according to the study?
The study evaluated down to 0.2 mL per measurement and considered the results viable at this volume, with between-assay RSD below 5%. For volumes below 1 mL, the authors recommend prior verification of performance in each laboratory.
Does reducing from 5 mL to 1 mL impair reproducibility?
Based on the presented data, not significantly. The between-assay precision remained at similar levels across the entire 2 to 25 µm range.
Why does variability increase at smaller volumes?
Because less volume means fewer particles counted. Since the count follows Poisson statistics, the relative variation increases as the absolute number of events decreases.
Why were the 25 µm particles problematic?
Due to sedimentation. With a sedimentation velocity on the order of 1 mm/s, longer analyses favor a drop in counts over the measurements. The effect was more evident at the 5 mL volume.
Is Light Obscuration suitable for particles below 10 µm?
The study indicated viability for monitoring particles from 2 µm upwards under the evaluated conditions, although traditional pharmacopoeial limits focus on ≥10 µm and ≥25 µm.
Which equipment was used in the interlaboratory comparison?
Light Obscuration particle counters KL-04A from Rion in four laboratories, and HIAC 9703 in two. The instruments were platforms for the study, without performance comparison between them.
Does the study replace method validation for a specific product?
No. The authors themselves state that the performance of methods with reduced volume must be verified for each product.