

Why evaluate the sampling line in addition to calibrating the particle counter
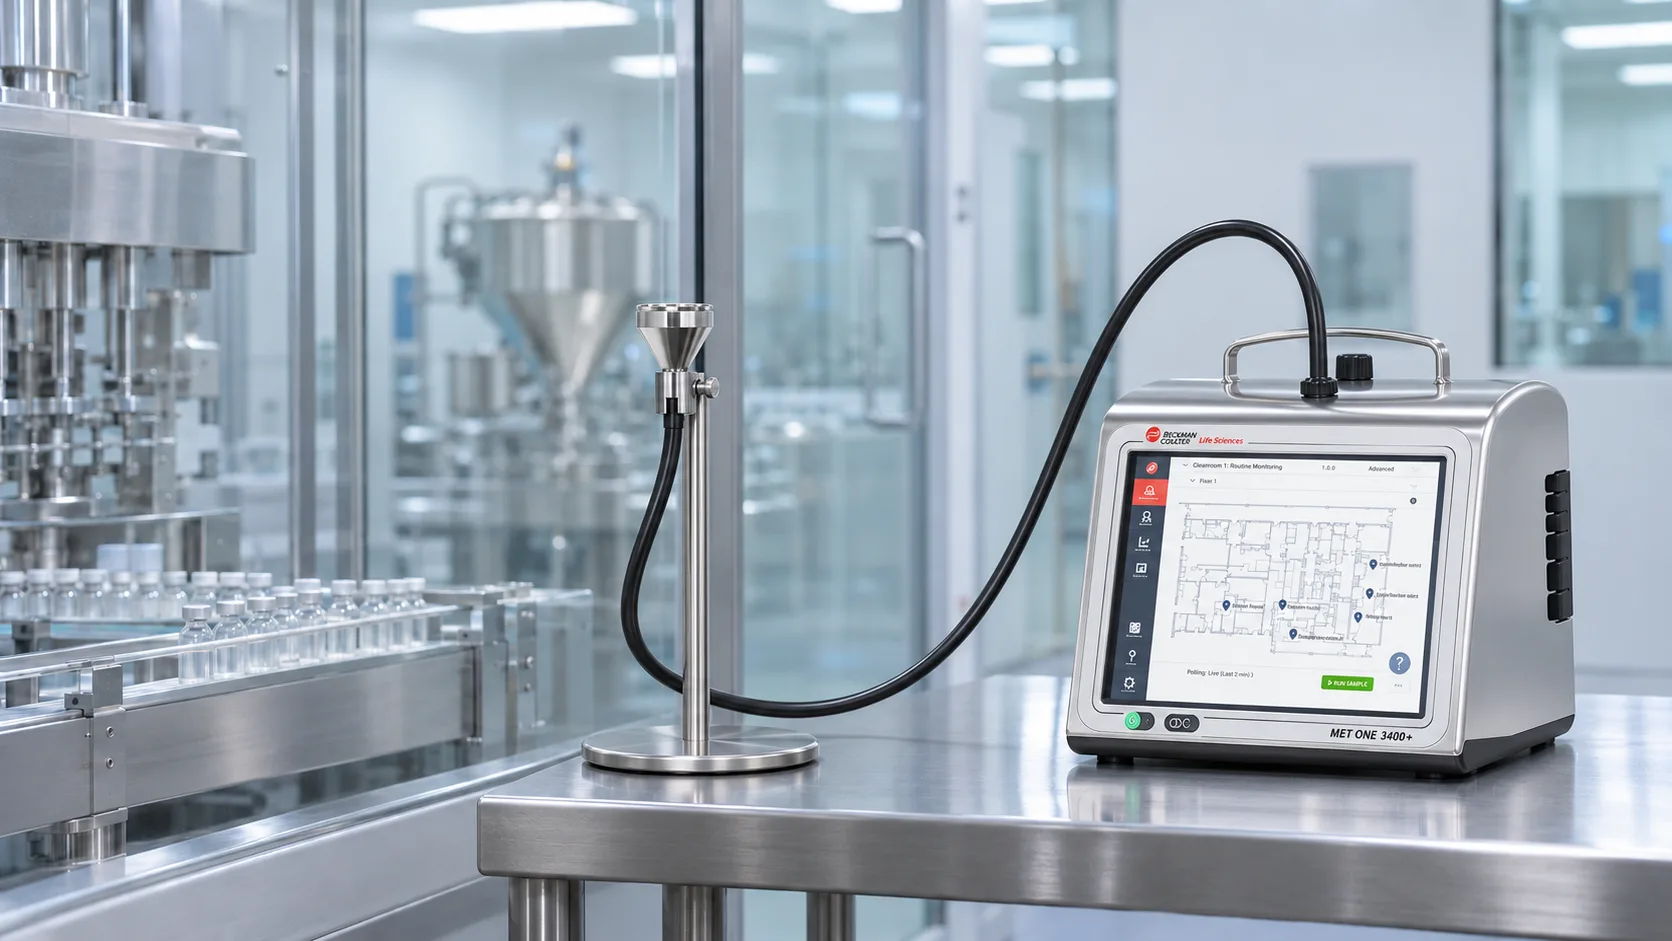
In particle counters used in cleanrooms, sampling tubing can affect results, particularly for 5 µm particles. Therefore, calibrating the instrument is not enough: it is also necessary to evaluate how particles travel from the monitoring point to the counter.
A study by Beckman Coulter and Pharmagraph, published in July 2026, demonstrated particle losses that varied according to the configuration tested. Read the original study.
In this article, you will learn:
- How tubing length and bends affect particle counts.
- Why 5 µm particles require particular attention.
- What results were obtained with MET ONE 6000 and 3400+ particle counters.
- What European Annex 1 recommends regarding sampling lines.
- What to check when installing or modifying a monitoring system.
Beckman Coulter and Pharmagraph study: particle transport through sampling lines
The study evaluated how different tubing configurations affect the transport of 0.5 and 5 µm particles to the counter. Results were compared against a 0.5 m reference line to determine the effects of modifying the sampling path.
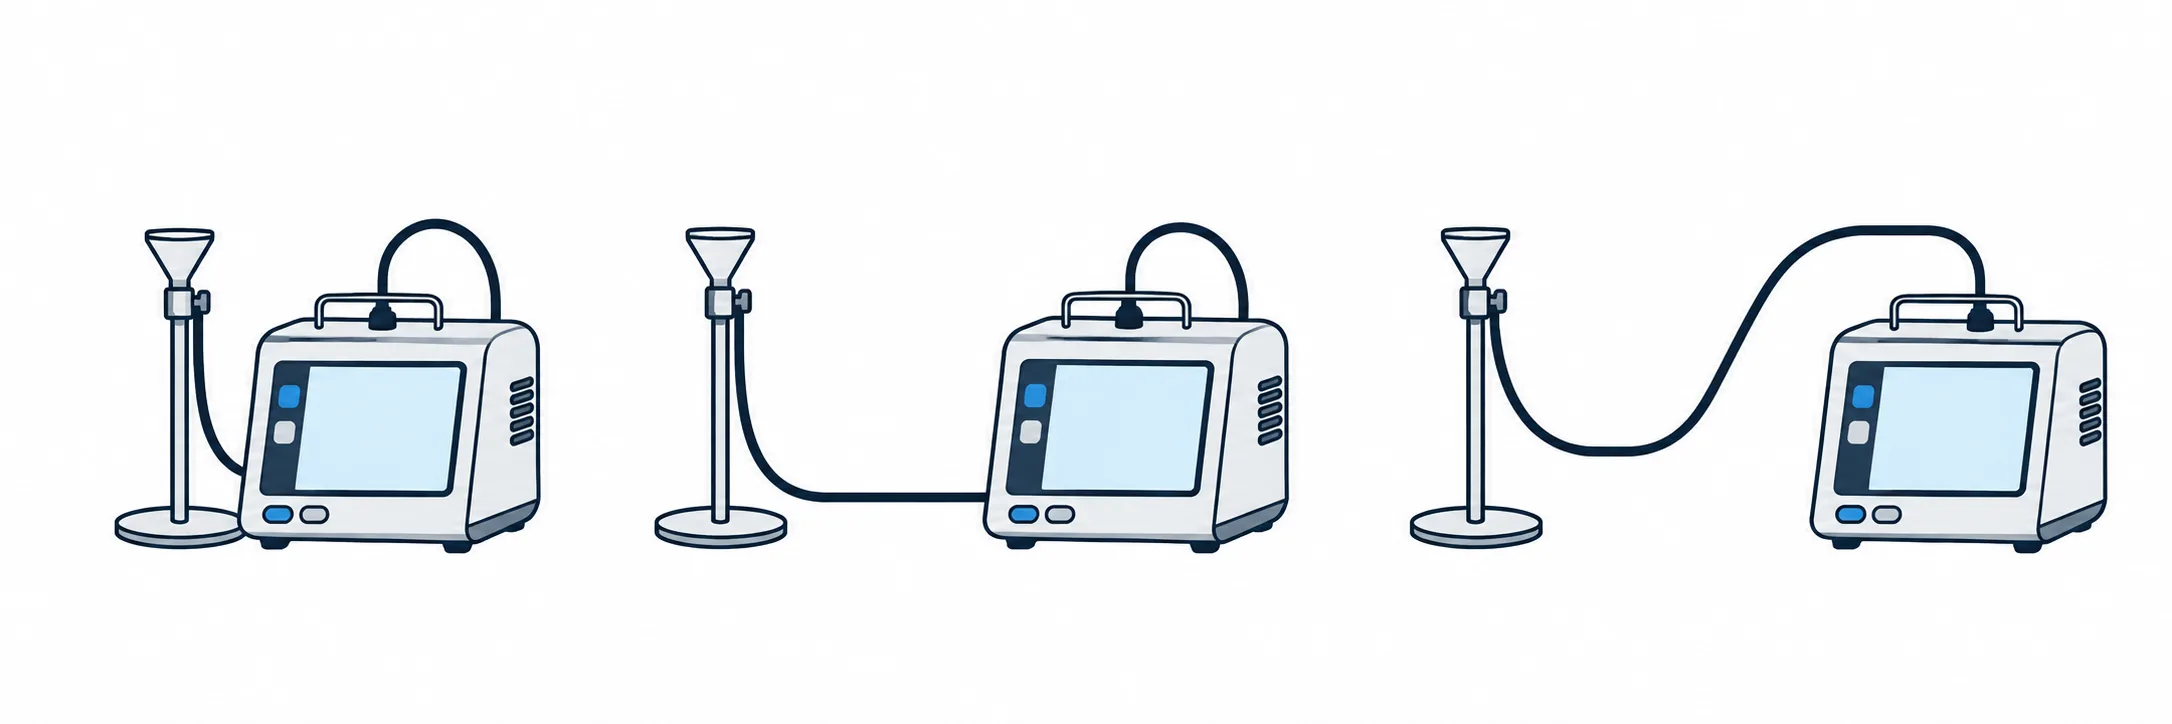
The tests used MET ONE 6000 and MET ONE 3400+ counters with Hytrel-lined tubing. Straight sections, bends, and a vertical drop were evaluated according to the instrument configuration.
| Condition | MET ONE 6000 | MET ONE 3400+ |
|---|---|---|
| Tested flow rate | 28.3 L/min | 28.3 and 100 L/min |
| Tubing inner diameter | ¼ inch | ⅜ inch |
| Particle sizes | 0.5 and 5 µm | 0.5 and 5 µm |
| Reference length | 0.5 m | 0.5 m |
| Maximum evaluated length | 3 m | 3 m |
For each configuration, 30 one-minute measurements were performed, with calculation of the mean and the 95% confidence interval. The tested bends complied with the manufacturer's recommended minimum bend radius of 100 mm.
What the experimental design allows us to conclude
Comparison with the reference line makes it possible to assess how particle counts changed when the tubing configuration was modified. However, the study does not isolate the effect of the counter model from that of the tubing diameter, since the two series used different tubing.
The results provide guidance for evaluating installations under conditions comparable to those studied. Review the study methodology.
How tubing length and bends affect particle counts
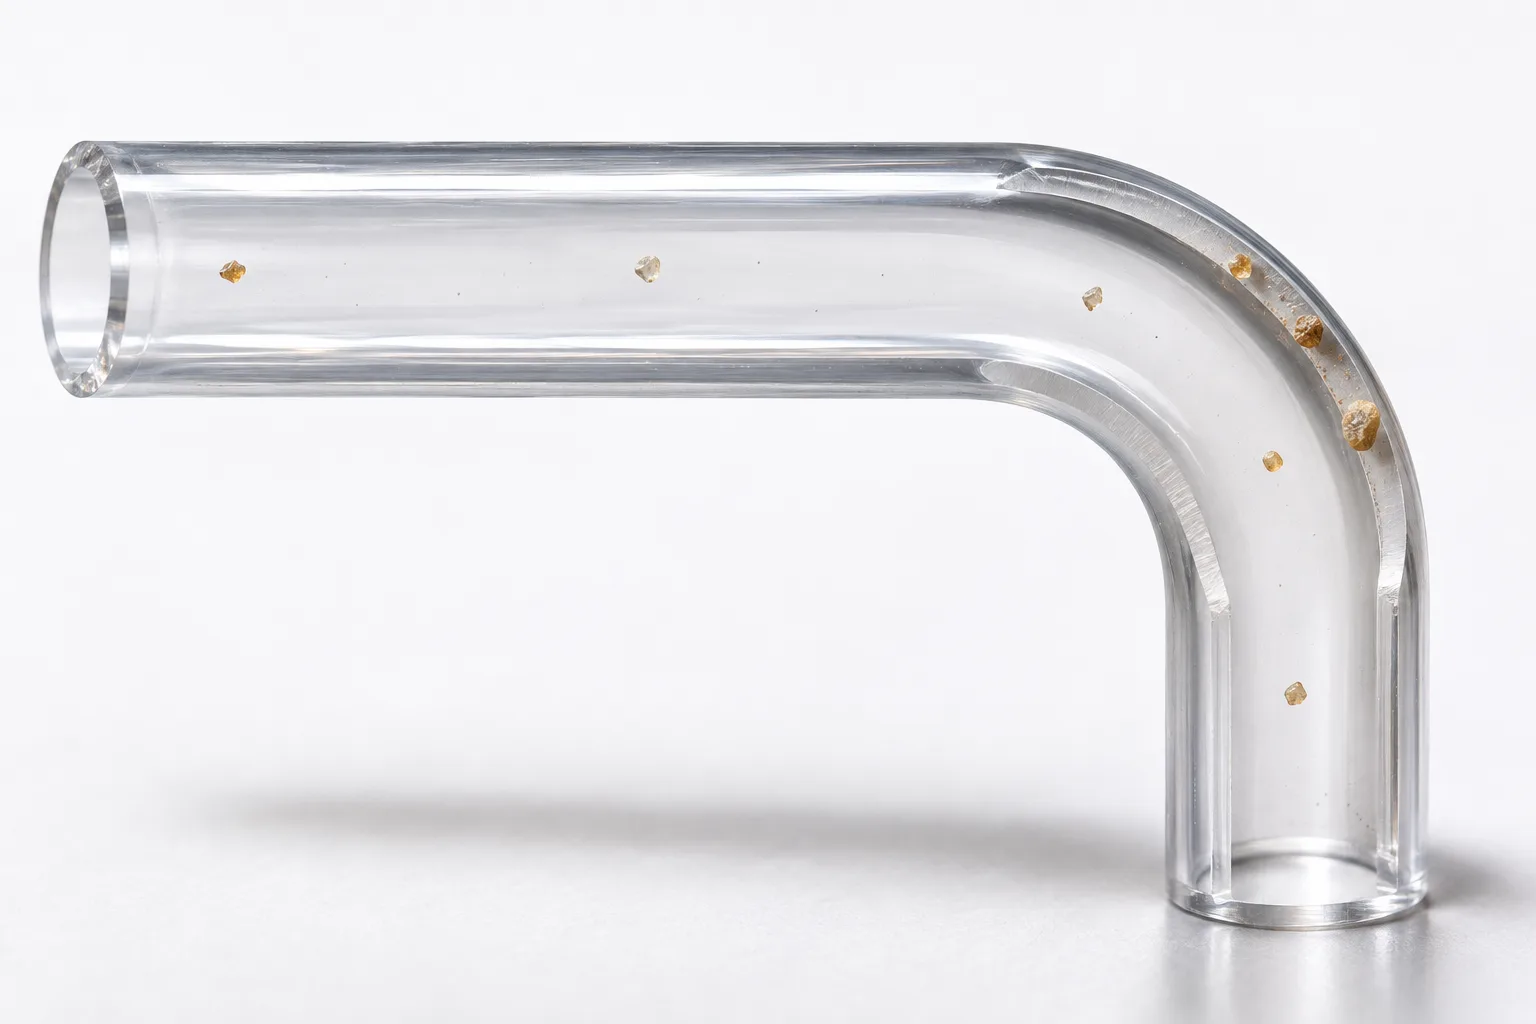
Particles must travel through the sampling line before reaching the detector. During transport, some particles may deposit on the tubing walls and consequently be excluded from the count.
A lower reading may reflect particle losses during transport, even when the concentration at the monitoring point has not decreased. Therefore, the sample transport path is part of the overall system evaluation.
Length and bends: longer paths create more opportunities for particle loss
Longer tubing increases the transport distance. In addition, bends change the direction of airflow and may increase particle impaction on tubing walls, particularly for larger particles.
However, there is no universal particle loss percentage per meter of tubing. The effect depends on the combination of length, bends, diameter, flow rate, and particle size.
Diameter and flow rate: a combination that must be verified
The inner diameter and flow rate determine the air velocity inside the sampling line. Consequently, replacing tubing without considering operating conditions may alter particle transport.
In practice, it is advisable to minimize unnecessary tubing lengths and bends, follow manufacturer specifications, and verify the performance of the installed configuration. European Annex 1 also recommends minimizing bends and justifying sampling lines that typically exceed one meter. Consult the official European Commission document.
Loss of 5 µm particles: differences compared with the 0.5 µm channel
A sampling line may adequately transport 0.5 µm particles while exhibiting substantial losses of 5 µm particles. Therefore, consistent results in the smaller particle channel do not demonstrate equivalent performance in both channels.
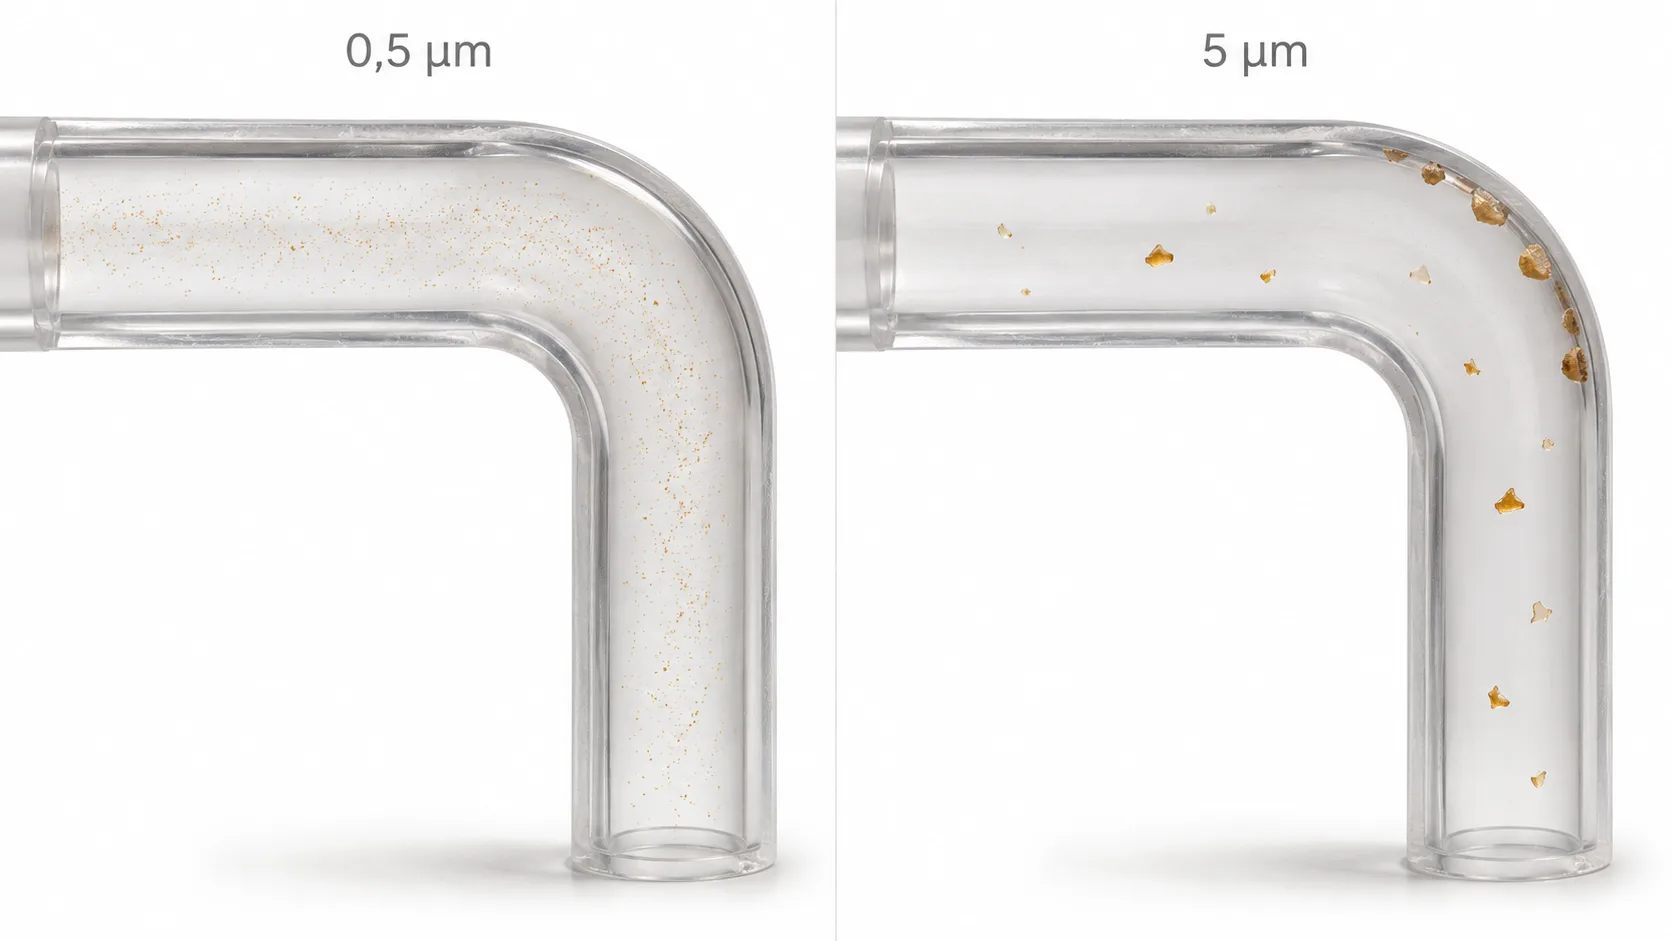
Larger particles have greater difficulty following changes in airflow direction. Sedimentation may also contribute to particle deposition during transport, depending on the sampling path and operating conditions.
What the study showed for each particle size
In the MET ONE 6000 configuration operating at 28.3 L/min with ¼-inch tubing, mean relative efficiencies for 0.5 µm particles ranged from 92% to 98%. In contrast, relative efficiency for 5 µm particles decreased to 15% in one of the tested configurations.
These percentages compare each sampling path against the 0.5 m reference line. They do not represent the isolated counting efficiency of the instrument or a correction factor applicable to other installations. Review the original results.
Implications for cleanroom monitoring
If the 5 µm particle count decreases after modifying a sampling line, the change should be investigated before attributing it to an improvement in environmental conditions. The evaluation should consider the previous sampling path, the new configuration, and process conditions during measurement.
Results with MET ONE 6000 and 3400+ particle counters
The results describe the performance of each configuration relative to a 0.5 m reference line. A value of 100% indicates a count equivalent to that reference; it does not represent absolute recovery of all particles present at the sampling point.
MET ONE 6000: effect of the sampling path on 5 µm particles

At a flow rate of 28.3 L/min with ¼-inch tubing, mean relative efficiencies decreased as the sampling path was extended and bends were introduced.
| Tubing configuration | Relative efficiency for 5 µm |
|---|---|
| 2 m straight | 76% ± 20% |
| 3 m straight | 37% ± 12% |
| 3 m with two bends | 21% ± 13% |
| 3 m with four bends | 16% ± 7% |
| 3 m with a 1 m vertical drop | 15% ± 5% |
The values represent the mean and the 95% confidence interval. For example, 37% ± 12% corresponds to an interval from 25% to 49%, entirely below the reference value.
This provides evidence of reduced particle counts under that experimental configuration. However, 37% must not be used as a correction factor for other three-meter sampling lines, because the result depends on the specific test conditions.
MET ONE 3400+: mean values close to the reference, with relevant uncertainty

With ⅜-inch tubing, the MET ONE 3415+ and 3445+ models, belonging to the MET ONE 3400+ series, produced the following results for 5 µm particles:
| Tubing configuration | MET ONE 3415+ — 28.3 L/min | MET ONE 3445+ — 100 L/min |
|---|---|---|
| 2 m straight | 98% ± 16% | 100% ± 32% |
| 2 m with two bends | 92% ± 17% | 100% ± 36% |
| 3 m straight | 93% ± 16% | 100% ± 33% |
| 3 m with two bends | 96% ± 20% | 100% ± 32% |
Mean values remained close to 100%, but the confidence intervals were wide, particularly at 100 L/min. Review the original study tables.
How to use these results when evaluating an installation
Demonstrating equivalence requires defining an acceptable difference in advance and applying an evaluation appropriate to that criterion. Therefore, a mean close to 100% is not sufficient to accept a sampling configuration.
The decision must consider the mean, its uncertainty, and the similarity between the experiment and the actual installation. Furthermore, differences in tubing diameter and flow rate prevent these tables from being interpreted as a ranking of particle counter performance.
Sampling tubing for particle counters: recommendations from European Annex 1
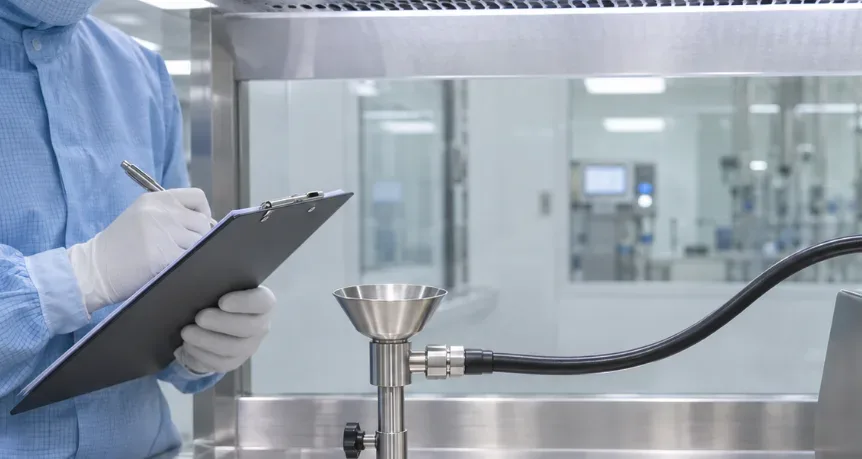
Section 5.9 of EU GMP Annex 1 establishes that particle counters must be qualified together with their sampling tubing. It also requires consideration of manufacturer specifications regarding tubing diameter and bend radius.
Tubing length: up to one meter unless justified
The document indicates that tubing length should normally be no more than one meter unless justified, and that the number of bends should be minimized. For cleanroom classification, it recommends using portable particle counters with short tubing lengths.
This does not mean that a one-meter sampling line automatically guarantees adequate particle transport. Nor does it justify accepting longer sampling paths solely because the instrument is calibrated: the configuration requires technical justification and evidence of performance.
Sampling probe location and orientation
In unidirectional airflow systems, Annex 1 specifies the use of isokinetic sampling heads. These must be correctly oriented and positioned as close as possible to the critical location to obtain a representative sample.
The position and orientation of the sampling probe must therefore be considered together with tubing length, bends, and the operating conditions of the monitoring system.
How to apply this reference in an Argentine facility
The requirements of European Annex 1 provide a technical reference for evaluating sampling systems in pharmaceutical cleanrooms. Their application in an Argentine facility must take into account the regulatory framework applicable to the establishment, its quality system, and the requirements of the process being monitored.
The purpose is not merely to comply with a specified tubing length, but to demonstrate that the installed configuration provides representative particle measurements at the intended monitoring points.
How to evaluate a particle counter installation in a cleanroom
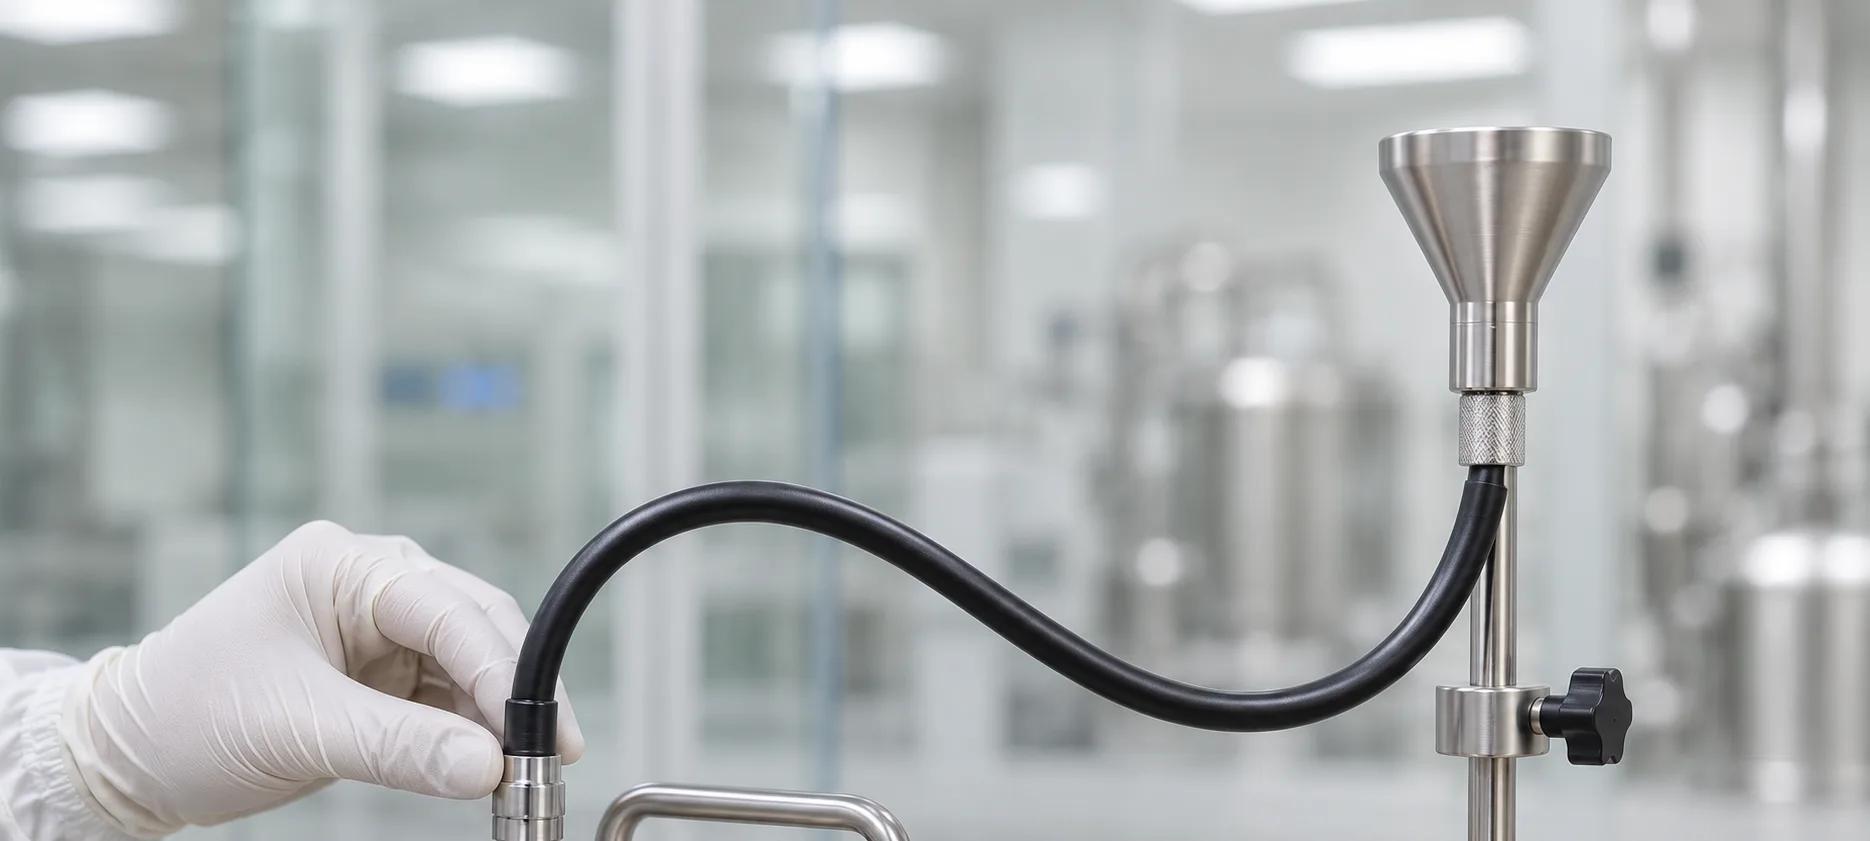
Physical inspection: check how the line is installed
The evaluation should begin with the actual configuration of the sampling line, including its length, inner diameter, bends, changes in elevation, connections, and the location of the sampling probe.
The inspection should identify unnecessary tubing sections, excessive bends, possible restrictions, and installation conditions that may affect sample transport.
Flow rate verification: check aspiration conditions
The sampling flow rate must be consistent with the particle counter specifications and the operating conditions of the installed system.
Checking the flow rate helps identify conditions that may affect sampling performance. However, an appropriate flow rate alone does not demonstrate that all relevant particle sizes are transported without significant losses.
Transport evaluation: obtain evidence of representativeness
The installed sampling configuration must be evaluated to determine whether the particles reaching the counter adequately represent the monitored location.
The assessment should consider the relevant particle sizes, the actual sampling path, and the operating conditions. Results from other installations or experimental configurations should not be applied automatically.
What to document and when to repeat the evaluation
Documentation should include the sampling line configuration, instrument identification, tubing dimensions, probe location, flow rate, evaluation methodology, results, and acceptance criteria.
The assessment should be reviewed whenever modifications to the tubing, probe, counter, or operating conditions could affect the representativeness of the sample.
How to select the particle counter and sampling line for each application
The selection of a particle counter must consider its intended use, required particle sizes, sampling flow rate, monitoring locations, and the configuration of the sampling lines.
Cleanroom classification and portable measurements
For classification, a portable particle counter for cleanroom classification allows the instrument to be positioned near the defined sampling points and short tubing sections to be used. These requirements guide the evaluation of the MET ONE 3400+ for portable measurements, according to the application requirements.
Continuous monitoring with remote particle counters
A continuous monitoring system requires evaluation of each fixed sampling line and its integration with process records and alarms. The evaluation of the MET ONE 6000 for remote particle counting in cleanrooms must consider the vacuum supply and the intended sample transport path.
Particle monitoring with an integrated pump

The MET ONE 6000P offers an alternative with an integrated pump for particle monitoring. Its selection must consider installation conditions and the requirements of each monitoring point; having its own pump does not eliminate the need to evaluate the sampling tubing.
Particle monitoring in critical environments

The MET ONE 7000 is another option to consider for continuous particle monitoring in critical environments. The configuration must be defined according to flow rate, sensitivity, environmental conditions, and integration requirements.
The experimental results presented in this article correspond to the tested configurations of the MET ONE 6000 and MET ONE 3400+. They must not be automatically extrapolated to the MET ONE 6000P, MET ONE 7000, or other installations. Explore the manufacturer's portfolio.
What information to prepare before requesting a quotation
To evaluate a configuration with INNOTEC, it is advisable to gather:
- Purpose: classification, routine monitoring, or continuous monitoring.
- Required particle sizes and flow rate.
- Sampling probe locations and expected distance to each counter.
- Tubing length, diameter, bends, and changes in elevation.
- Data recording, alarm, and system integration requirements.
Particle counters: reliability also depends on sampling
A calibrated particle counter requires a suitable sampling line to provide representative results. Tubing length, bends, diameter, and flow rate can affect particle transport, particularly for 5 µm particles. Therefore, these factors must be evaluated when selecting, installing, or modifying the system.
Contact INNOTEC to select your particle counter
Do you need a particle counter for cleanrooms or want to review your system configuration? Contact INNOTEC to evaluate MET ONE options and the sampling requirements of your application.
Email info@innoteclatam.com or call +54 11 7079-4042.
Source: https://www.beckman.com/resources/reading-material/application-notes/the-effects-of-tubing-length-on-airborne-particulate-sampling